Open-source data visualization
Grafana is an open-source platform for data visualization and monitoring. It is a popular choice among IT professionals and companies looking for a powerful and flexible solution for visualizing their data.
Flexible Data Sources
Grafana supports a wide range of data sources, including time series databases, SQL databases and cloud services. This makes it easy to combine and visualize data from different sources.
Alerting and notifications
Grafana provides powerful alerting and notification features that allow users to be notified of any problems or anomalies in their data. You can set up custom alerts and notifications to ensure that you stay informed of important events.
Active community
Grafana has an active community of users and developers who regularly contribute new features and improvements. This ensures that the platform is constantly updated and improved.
Future-proof
Grafana continues to develop and evolve to meet the changing needs of the IT industry. It is a future-proof solution that will help you visualize your data both now and in the future.
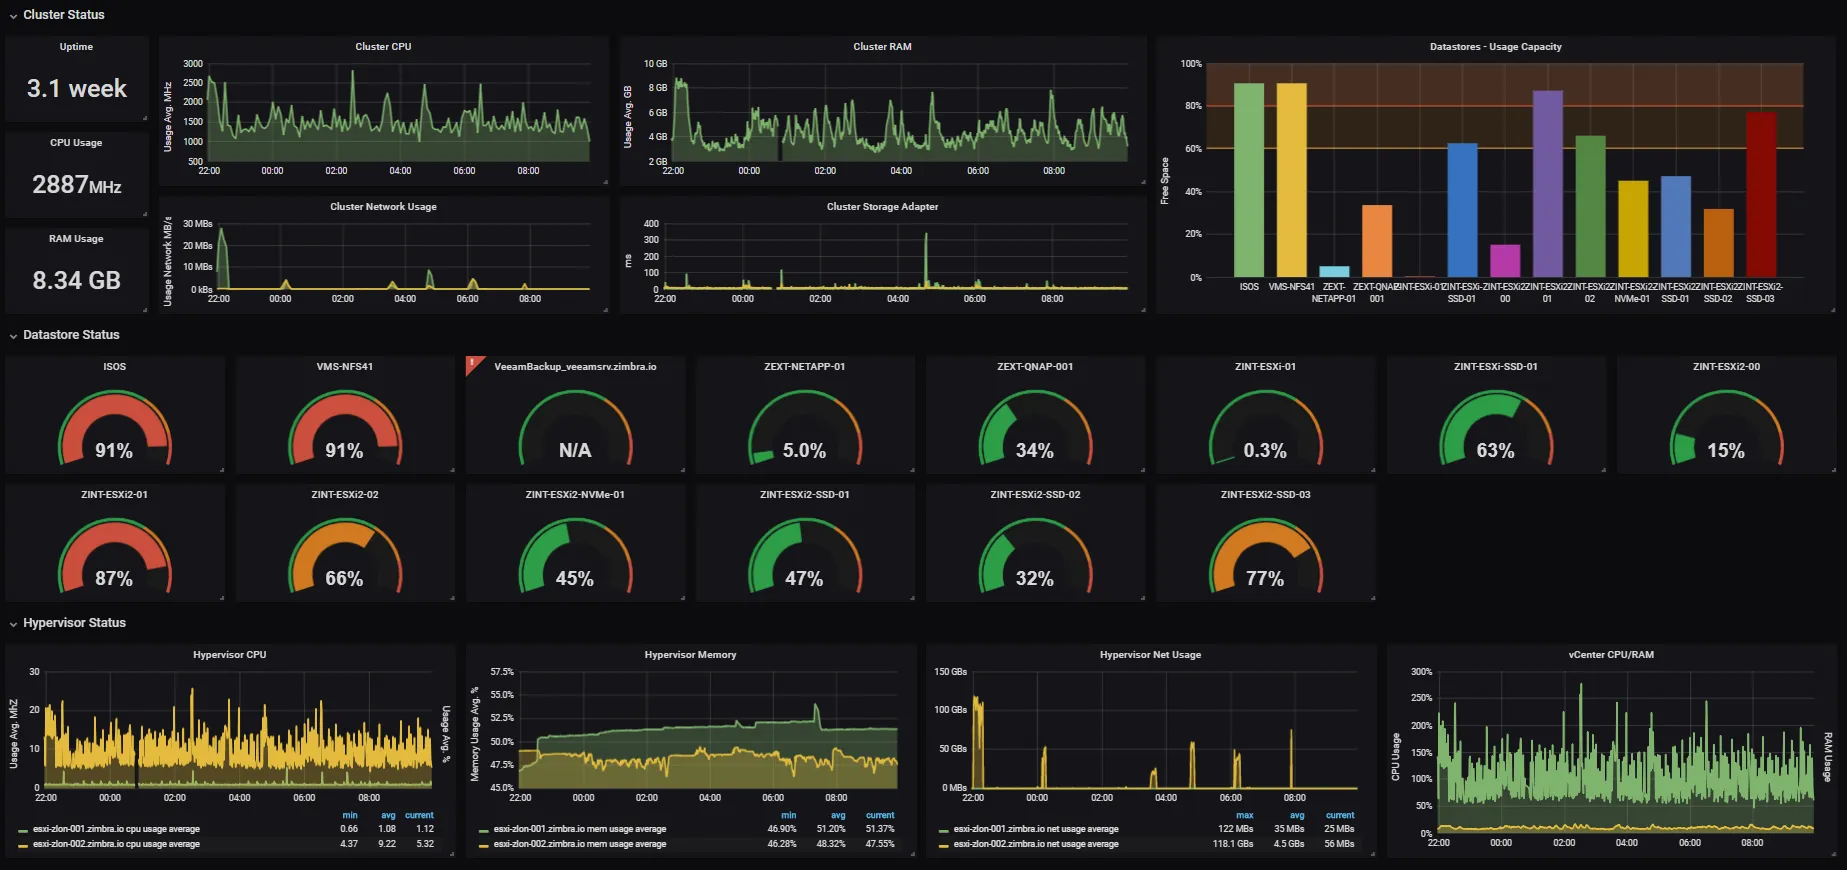
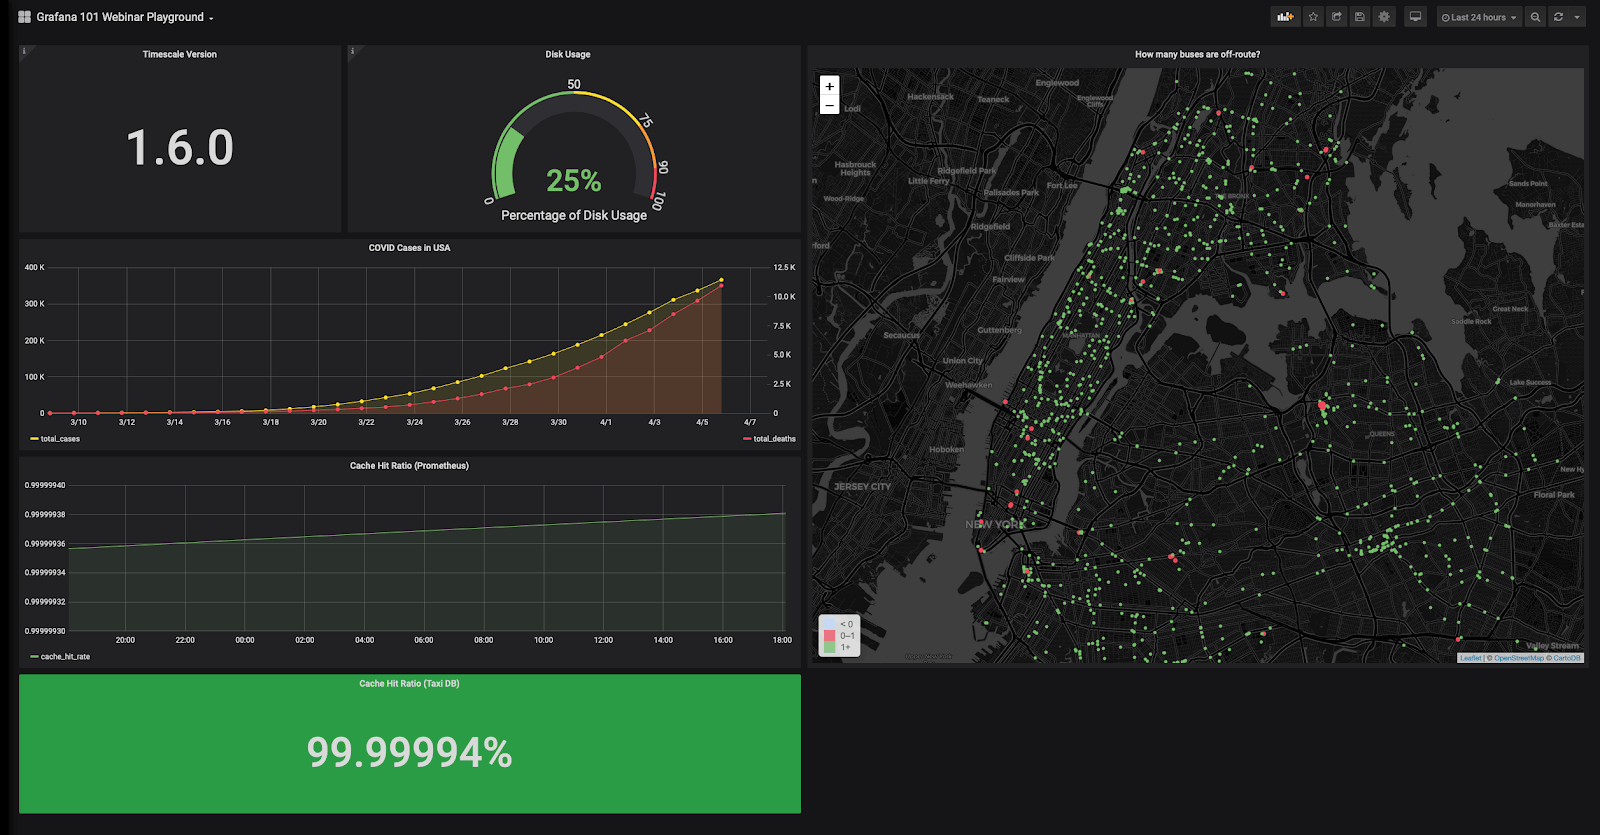
Extensive visualization options
Grafana offers a wide range of visualization options, including charts, tables, maps and dashboards. This makes it easy to gain insight into your data and identify trends and patterns.
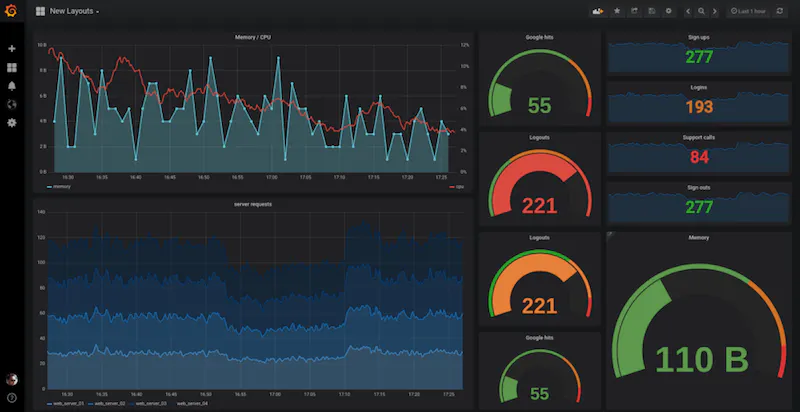
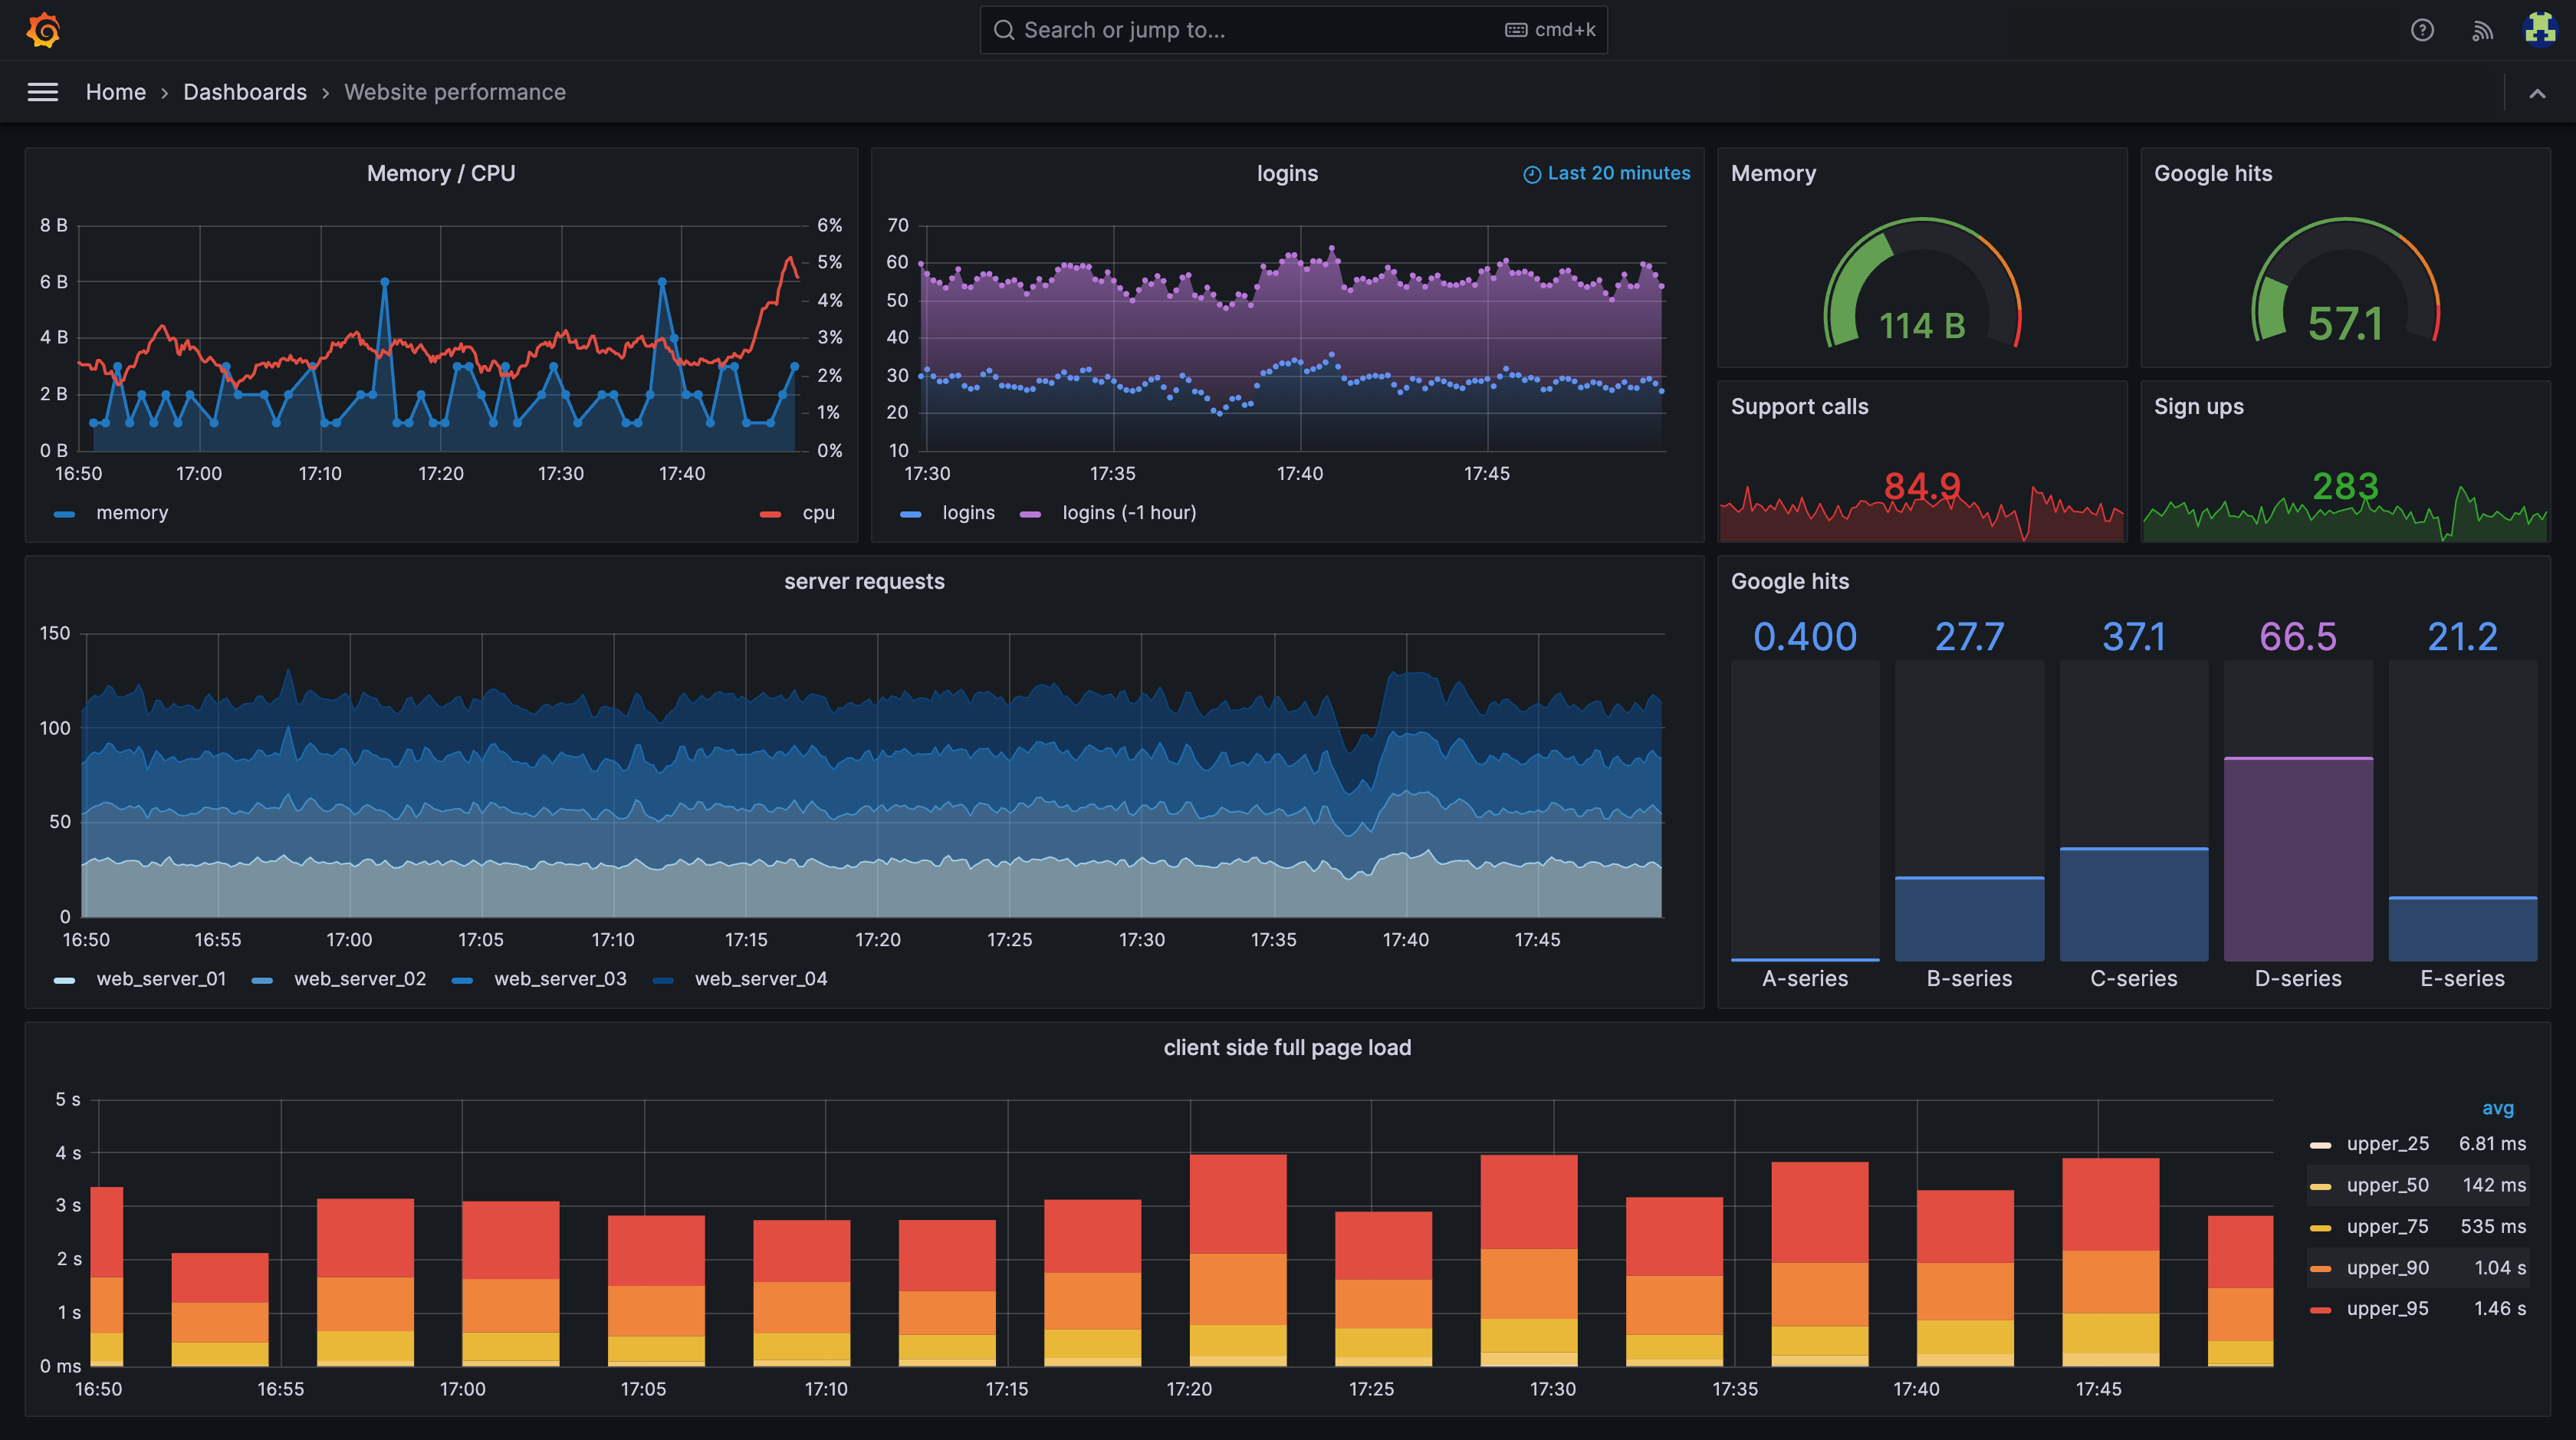
Customizable dashboards
Grafana provides customizable dashboards that allow users to organize and present their data in a way that makes sense to them. You can use custom layouts, colors and styles to tailor your dashboards to your specific needs.
Integration with other tools
Grafana can be easily integrated with other popular IT management tools, making it an excellent choice for companies looking for a flexible and customizable data visualization solution
Cost-effective
Grafana is an open-source platform, which means it is free to use. Paid support options are also available for companies that need additional help.
User-friendly
Grafana was designed with usability in mind. It provides an intuitive and user-friendly interface that allows users to easily visualize and analyze their data.